Quantifying Electoral Malpractice via the Biased Random Voting Model

Extending universal election statistics to detect and measure unfair elections
Building on PRL 134, 017401 (2025)
Background

Elections Follow a Universal Distribution

The Random Voting Model: draw c random weights, normalize to probabilities, generate multinomial votes. A null model with zero parameters.

The specific margin $\mu = M / T$ (winner–runner-up gap divided by total votes) follows a universal distribution $P(\mu)$ that depends only on $c$, not on turnout, geography, or political system.

Validated across 34 countries, from Indian state elections to European parliamentary races.

Analytical result for $c = 3$ candidates
$$P(\mu) = \frac{(1-\mu)(5+7\mu)}{(1+\mu)^2(1+2\mu)^2}$$
Motivation

If Fair Elections Are Universal, Malpractice Is Deviation

Current fraud detection methods — Benford's law, Klimek fingerprinting — lack a principled null model. They detect anomalies relative to ad hoc expectations.

The RVM provides exactly what's missing: a parameter-free theoretical prediction for what fair elections look like.

The logic is simple:

Fair election → margin distribution matches the universal curve.
Deviation from the universal curve → quantifiable anomaly.

This turns fraud detection from a pattern-matching exercise into a principled statistical test with a well-defined null hypothesis.

Model

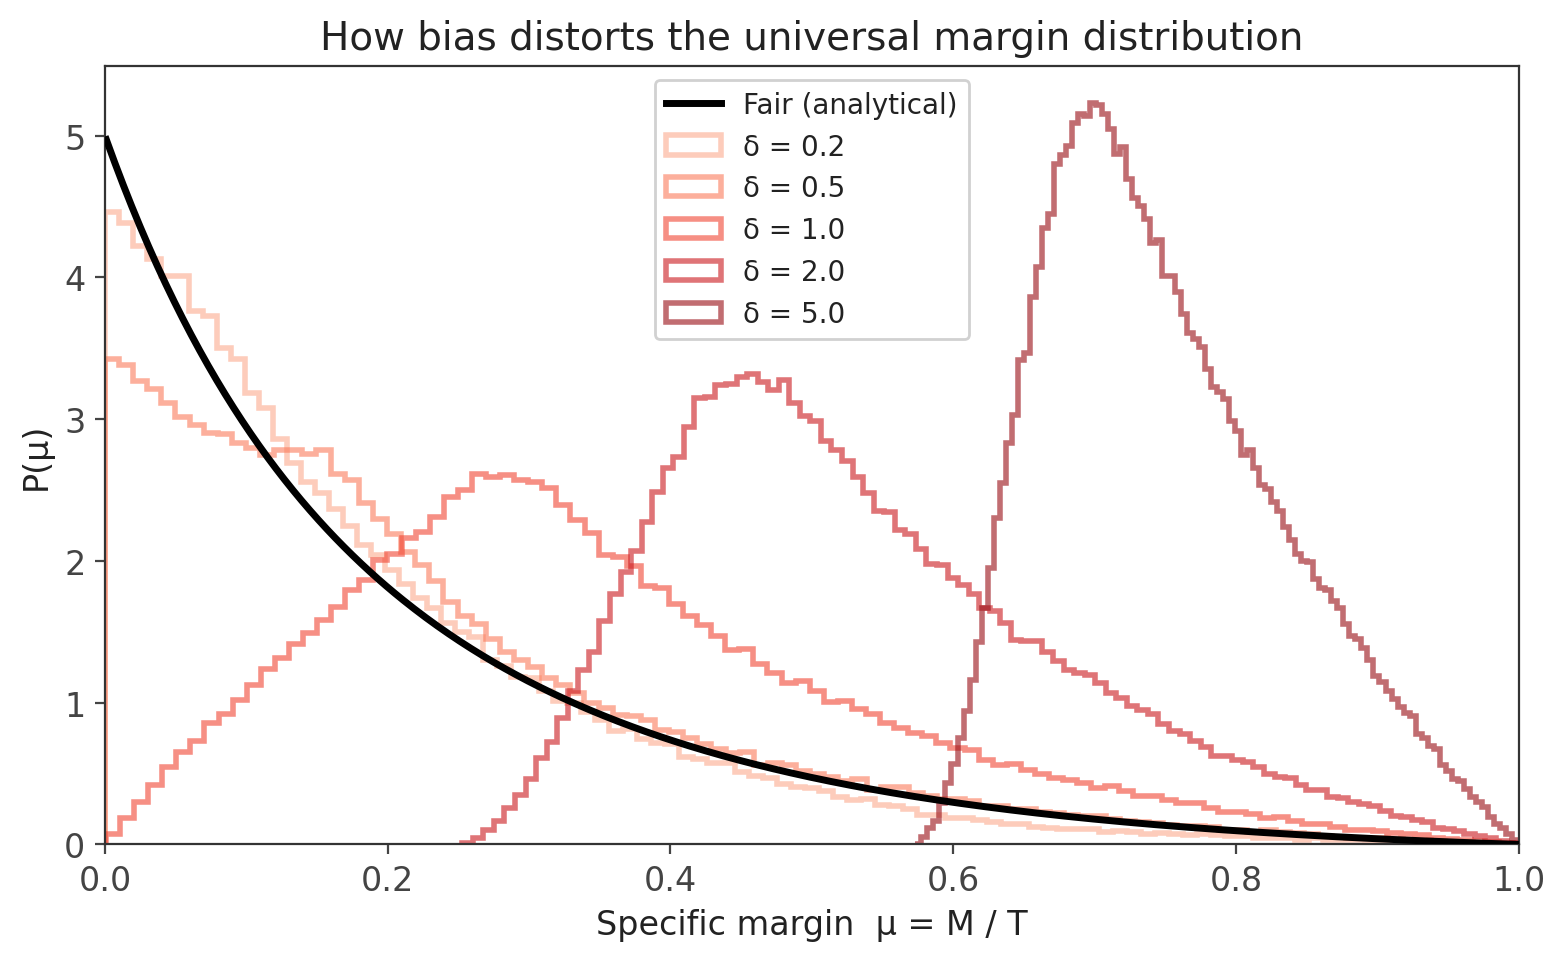
The Biased RVM: A Minimal Model of Malpractice

Standard RVM: weights $w_i \sim U(0,1)$, normalize $\rightarrow$ probabilities

Biased RVM: $w_1 \rightarrow w_1 + \delta$ before normalization

$\delta = 0$ recovers the fair election. $\delta > 0$ gives candidate 1 a systematic advantage.

The bias parameter
$\delta$ is not vote stuffing — it models
structural bias: media capture,
institutional advantage, coercion,
or uneven playing fields.
Effect of bias parameter on margin distribution
Diagnostics

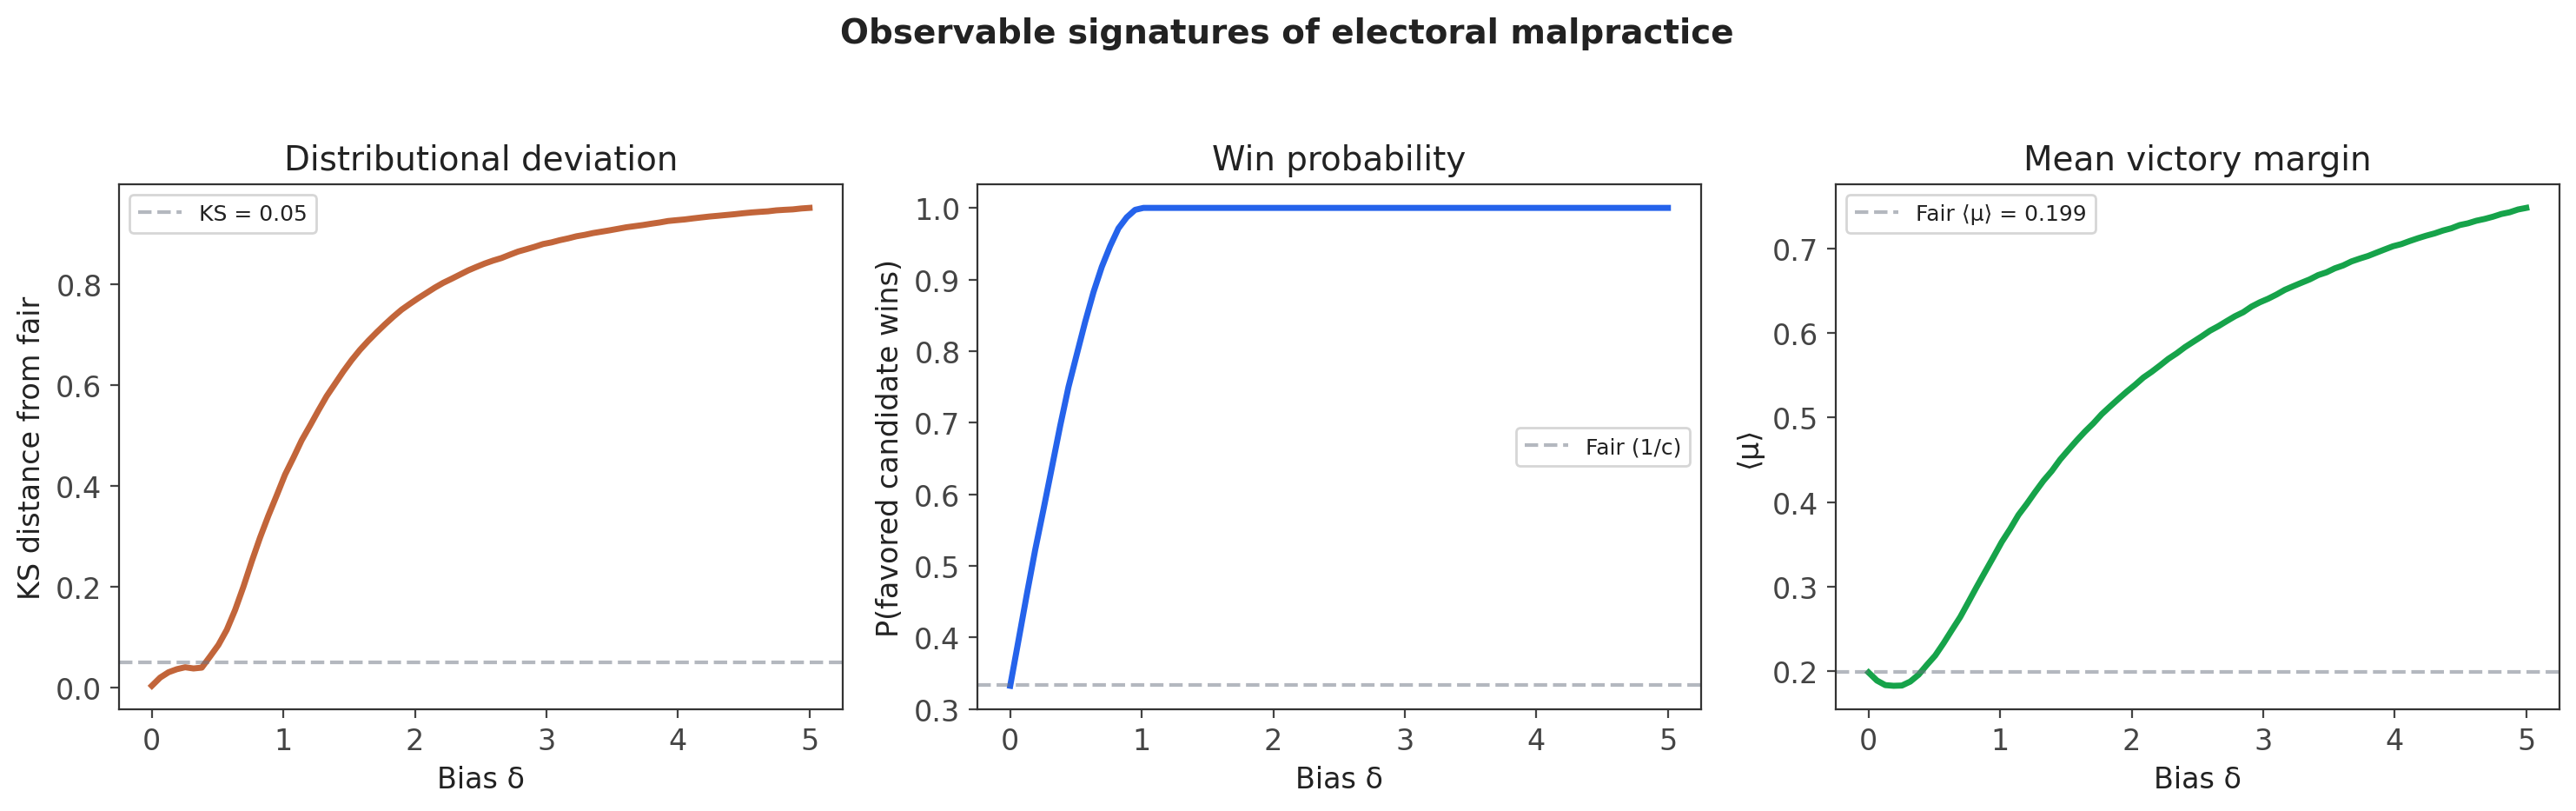
Observable Signatures of Bias

  • KS distance from the fair distribution grows monotonically with $\delta$
  • Win probability of the favored candidate exceeds $1/c$
  • Mean victory margin $\langle\mu\rangle$ increases — races become less competitive
  • All three are monotonic in $\delta$, making the bias parameter identifiable from data
Bias signatures: KS distance, win probability, mean margin vs delta
Inference

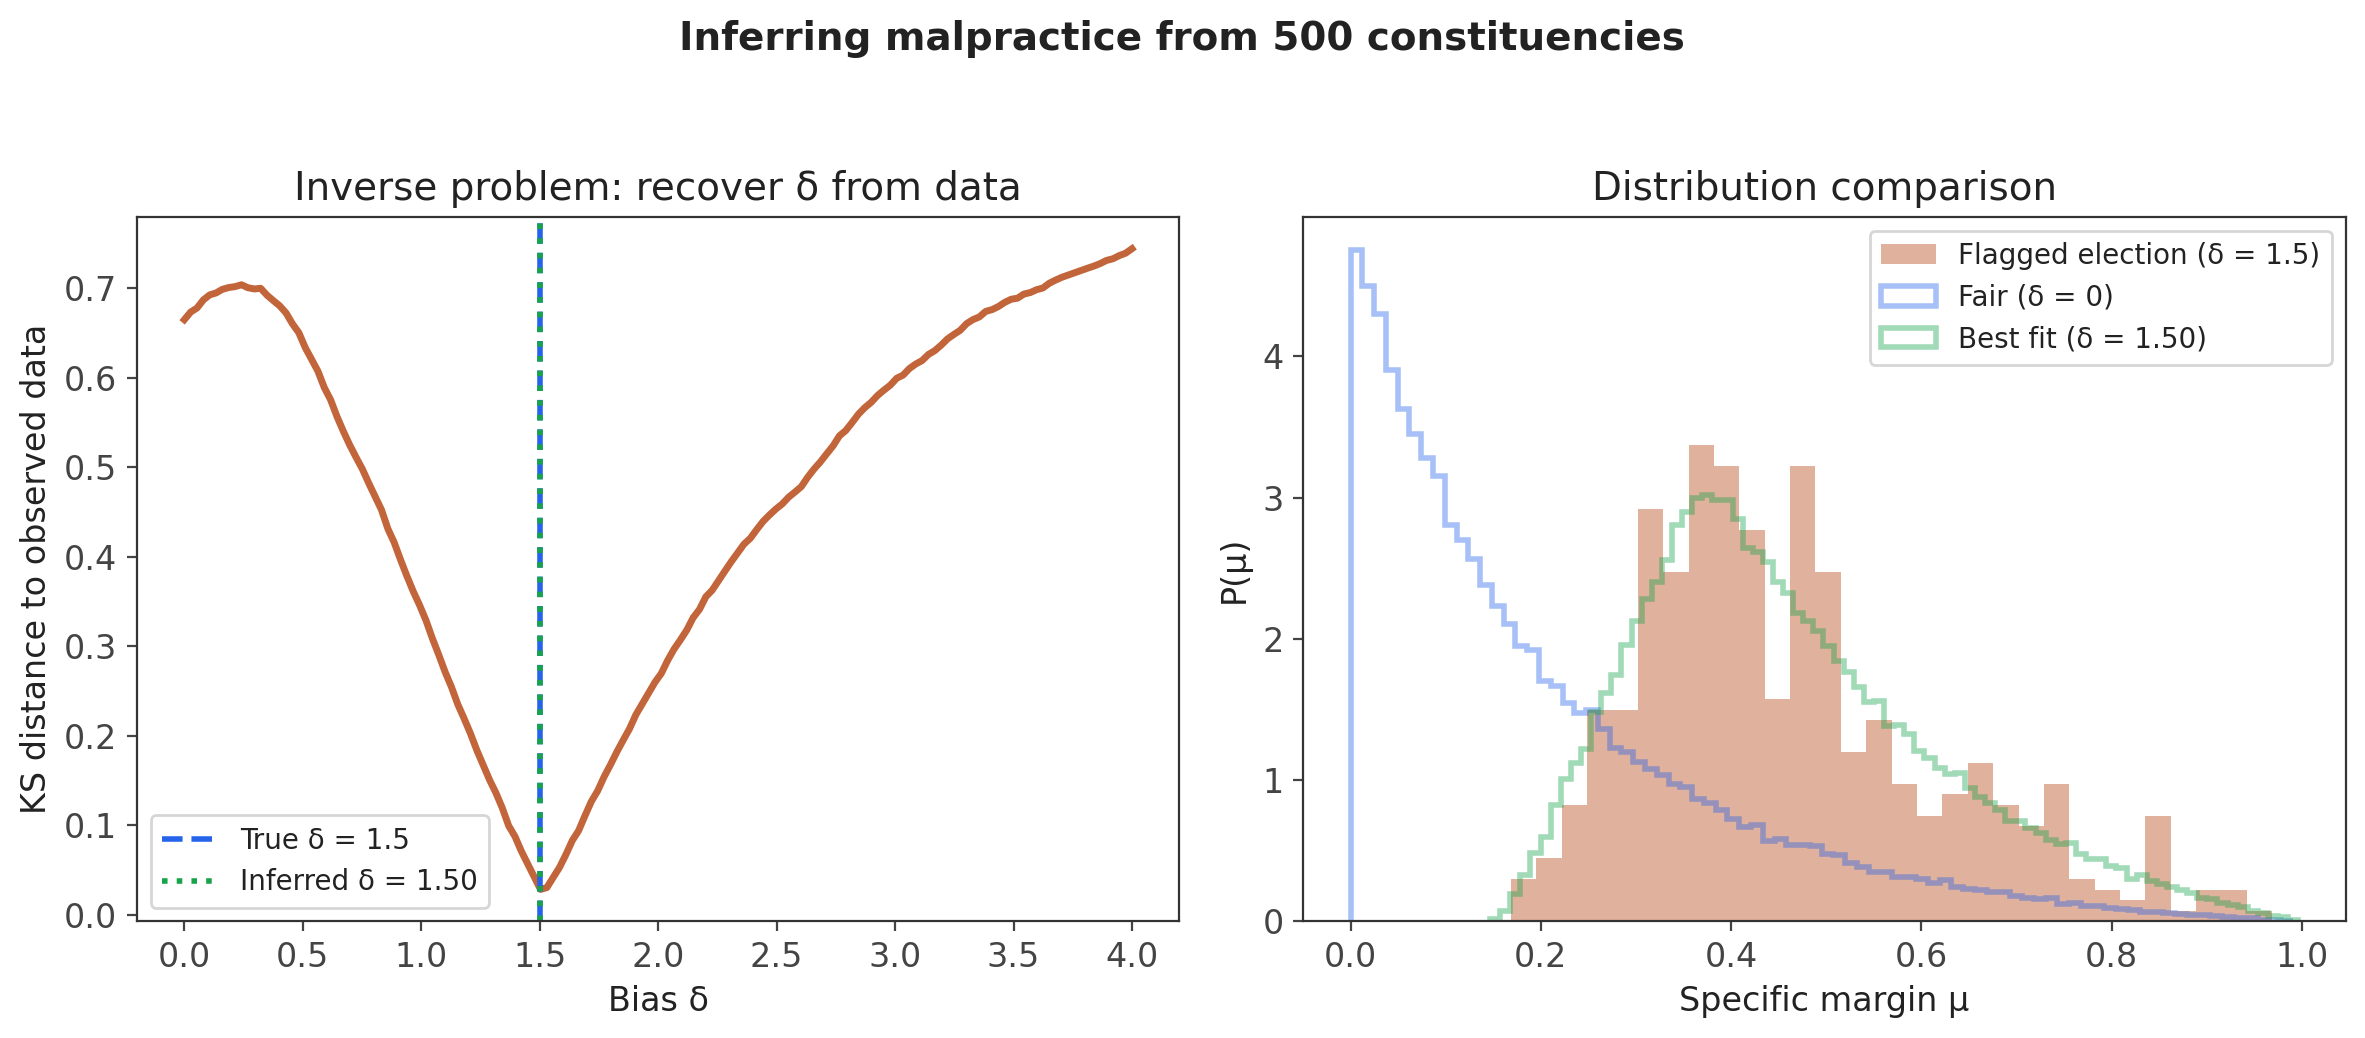
The Inverse Problem: Inferring $\delta$ from Data

Given an observed election with $N$ constituencies, compute the empirical margin distribution.

Sweep $\delta$ in the biased RVM, find $\delta^*$ that minimizes the KS distance to the observed data.

$\delta^*$ is a quantitative malpractice index:

"How much structural bias is needed to reproduce this election's statistics?"

Continuous, interpretable, and grounded in a principled null model.

Inference of delta from observed election data
Hypothesis Testing

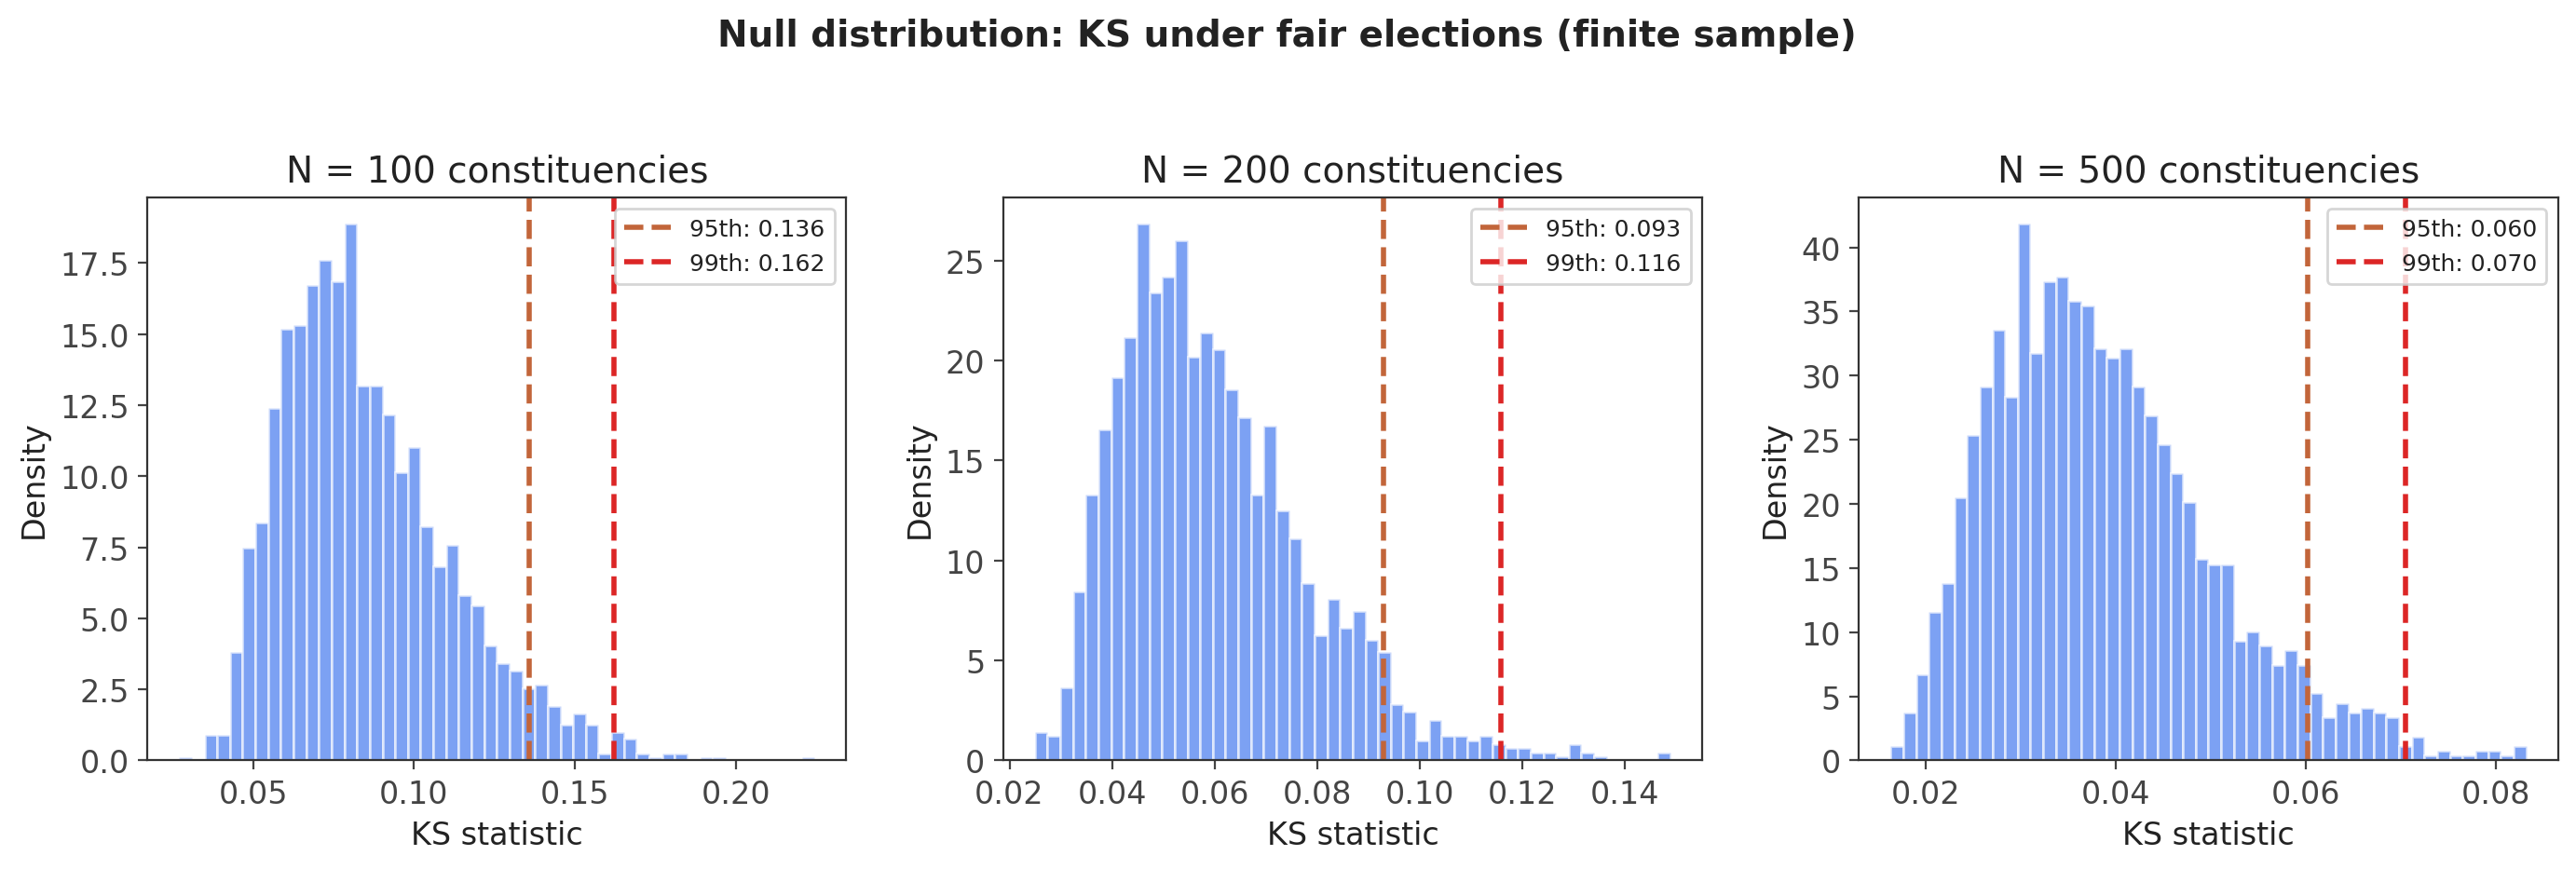
Distinguishing Malpractice from Noise

With $N = 500$ constituencies, sampling noise alone produces non-zero KS distance even for perfectly fair elections.

Solution: build a null distribution of KS statistics under the fair RVM at the actual sample size.

Proper hypothesis test: reject $H_0(\text{fair})$ if observed KS exceeds the 95th percentile of the null distribution.

Decision rule
$$\text{KS}_{\text{obs}} > \text{KS}_{\text{null}}^{(95\%)} \implies \text{reject fairness at } 5\% \text{ level}$$
Null distribution of KS statistic under fair RVM
Looking ahead

Open Questions & Next Steps

Types of bias

Uniform $\delta$ vs constituency-specific $\delta_i$ — what if only some races are manipulated while others remain fair?

Multiple candidates

Which candidate gets the edge? Can we infer the identity of the favored candidate, not just the magnitude of bias?

Finite turnout effects

The $T^{-0.73}$ convergence to universality interacts with bias detection — how does finite size affect power?

Real data validation

Apply to elections with documented irregularities — do known problematic elections produce elevated $\delta^*$?

Temporal dynamics & optimal transport

Connection to Schrödinger bridges: model how margin distributions evolve between elections, linking bias to dynamical processes.

Summary

From Universality to a Malpractice Index

1 Clean elections → universal statistics. The RVM predicts a parameter-free margin distribution validated across 34 countries. (PRL 2025)
2 Malpractice → parameterized deviation. The biased RVM introduces $\delta$ as a minimal, interpretable model of structural unfairness.
3 $\delta^*$ as a quantitative malpractice index. Inferred from data via KS minimization — continuous, principled, and testable against a proper null.
Not binary (fraud / no fraud) but a spectrum — how much unfairness?
1 / 9